


 Many operators don’t fully understand how to read a restaurant P&L. In fact, many don’t even have a basic understanding of where the data is coming from or how to derive actionable insights from the data.
Understanding how to read a restaurant’s income statement is essential for the financial success of restaurants. The people responsible for making scheduling and buying decisions need to be aware of this. It’s even more important that they can utilize the knowledge behind what goes into the P&L.
Below we take you through an example, top to bottom, of a restaurant profit and loss Statement to uncover the following:
Many operators don’t fully understand how to read a restaurant P&L. In fact, many don’t even have a basic understanding of where the data is coming from or how to derive actionable insights from the data.
Understanding how to read a restaurant’s income statement is essential for the financial success of restaurants. The people responsible for making scheduling and buying decisions need to be aware of this. It’s even more important that they can utilize the knowledge behind what goes into the P&L.
Below we take you through an example, top to bottom, of a restaurant profit and loss Statement to uncover the following:
- Best practices behind how to utilize your weekly Profit and Loss Statement to maximize your profitability
- How to find actionable items to improve upon
- How to get your management team to take ownership and accountability for financial results
- In doing this, they can report results back to you, versus you having to ask questions
What is a restaurant income statement?
A restaurant income statement, often referred to as a restaurant profit and loss statement or P&L is one of the major financial documents that lays out and describes revenue and expenses over a selected period of time. Restaurant operators use this crucial statement in a few ways:- To understand the net profit and losses of their restaurant over a period of time
- To pinpoint and make better business decisions after identifying areas of weakness and opportunities
Breakdown of a Restaurant Profit and Loss Statement
- Sales
- Cost of Goods
- Labor Expenses
- Direct Operating Costs
- Advertising & Promotion Costs
- Which Expenses Are Left?
- Best Practices for Profit and Loss Reviews
Sales
GROSS VS NET SALES
Gross Sales is the entirety of all your sales, including sales tax, comps, and discounts. Most restaurants should analyze their financial information and business health based on adjusted net sales or gross minus sales tax. Even though the customer has to pay sales tax, that is a “pass-through” expense that you collect from the customer and pay to the state. When you say that your labor is at 30%, one should be able to assume that you mean a percent of your adjusted net sales. Do not factor in the sales tax you collect, but do factor in the sales that have been comped or discounted – This helps give you a true analysis of how you’re executing based on your full sales. True Net is Gross Sales minus Sales Tax, minus comps and discounts. This is most commonly used for restaurants that need proof of sales for their lease contracts; Maybe their rent is based on a percentage of sales, or once they reach the breaking point of sales, additional rent kicks in.MASTER SALES DEPARTMENT (MSD) GROUPS
Master Sales Departments: This is referring to the different categories you have set up to categorize your sales. You might have categories like NA BEV, WINE, FOOD, BTL BEER, or DRFT BEER. The answer to how granular you should get depends heavily on your concept; there is not a one-size-fits-all. If NA BEVs make up 5 % of your revenue, do you need to have a category for teas, coffees, and others? Probably not. But, if you are a coffee place and that makes up 80% of your revenue, you would absolutely need to be able to analyze your costs separately. With any MSD category, ask yourself: “Is there value in separating these sales?”TOP LINE SALES VS OTHER INCOME
On your P & L statement, most of your revenue should be at the top so that when evaluating costs as a % of sales, you have a solid basis to divide them into. However, some examples of income to the restaurant may want to live all the way at the bottom of your P&L and not be included in the sales basis. The most common example of this is when a restaurant sells swag, tee shirts, or hats – this is a great business activity but does not normally make up a large amount of your revenue. Additionally, when you are evaluating your operational labor, retail sales should probably not factor in, i.e. you shouldn’t be writing your server schedule based on how much in retail sales you think you’ll be selling. Other Income should live at the bottom of your P&L and should be separated out.
Throughout this post, we are going to simplify your P & L statement by pretending like all your sales = $1. This is a great way to reinforce why evaluating expenses as a percentage of your sales is the best approach.
As we go through a restaurant p&l example, think of your sales equaling 100% or $1, and think of your cost % as pennies taken away from that dollar.
Cost of Goods
The first (and one of the most significant) expenses for restaurants is Cost of Sales (COS) and the first Prime Cost area on your Profit & Loss. In the example of what we are showing below, you see that you have a Food Cost Category with GLs that make up those expenses, and then you will see your Pour Cost broken down as well. At the bottom, you will see the combination of both Cost Categories to determine your overall total cost of sales.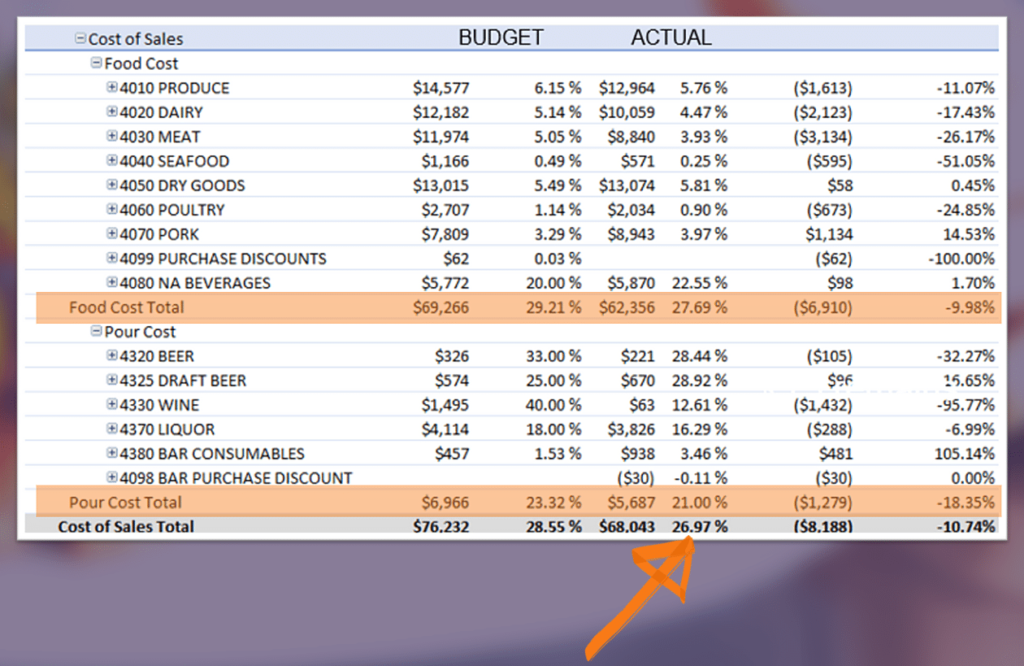
TOTAL COST OF SALES = 26.97% WE’VE NOW SPENT $0.27 SO HOW MUCH OF YOUR $1.00 IS LEFT? $.73 REMAINS
WHAT SHOULD BE REFLECTED IN EITHER FOOD COST AND POUR COST:
- The NA Bev conundrum – Many ask if NA (non-alcoholic) beverage should be part of Food Cost or Pour Cost. This answer may differ depending on your concept.
- If you are a bar and a heavy % of your sales are coming from the bar, then we suggest having this be a part of your Pour Cost. If you are more of a full-service restaurant with a high % of Food Sales/NA Bev sales, then we would default to having this be a part of your Food Cost. The cost basis should always be sales department to cost department, so your NA beverage cost will be based on your NA Beverage sales.
- Bar consumables – Remember that there are many other items that impact your Beverage Cost as they are ingredients for your mixed beverage drinks. These items should be accounted for in your overall Pour Cost, not Food Cost. Items like Lemons, Limes, Oranges, Herbs, etc. are being used in those drinks and should be factored in. Since Bar Consumables are needed for Liquor drinks, this line item would be a cost basis of your total Liquor sales.
Labor Expenses
Labor is the largest expense for most restaurants. Working off the same P&L statement we looked at for Cost of Goods, let’s look at how this labor is broken out. Even though you may have an overall labor target, we suggest breaking the operational labor separately within your overall labor. Think of your operational labor as the labor that restaurant managers have the most control over. This is hourly labor; you can impact this through your scheduling and cutting, and the better the manager, the better they’ll staff appropriately for what their sales are going to be. The rest of your labor should include salaries, payroll taxes, employee benefits, and employee discounts. And now you have another benchmark to look at, your total labor.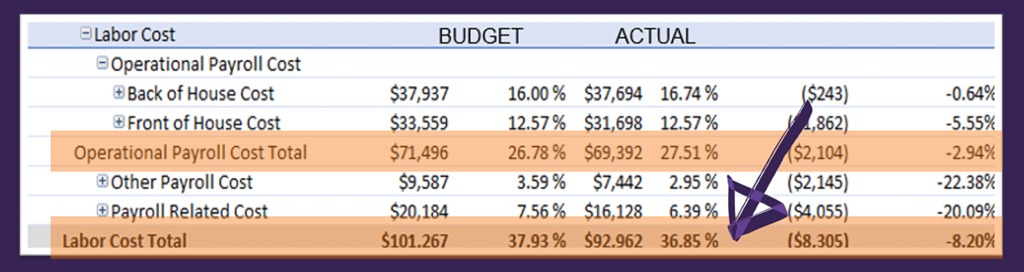
TOTAL LABOR COST = 36.85% AFTER YOU PAY FOR THE FOOD AND PEOPLE TO SERVE IT, HOW MUCH OF YOUR $1.00 IS LEFT? $.36 REMAINS
OTHER CONSIDERATIONS WHEN IT COMES TO LABOR:
- Bonuses – Typically, incentive/bonus plans are paid out based on hitting targeted cost goals. One of those areas is Labor. If they hit a bonus, that could negatively impact their next period’s labor goals if this is being accounted for in Labor – hitting bonuses shouldn’t impact whether or not they hit the next period’s cost goal.
- Employee-Related Discounts – Typically, you should have all employee meal discounts hit your fully burdened labor since, in all reality, this is considered an employee benefit and part of their benefits package, which is considered a labor expense.
GROSS PROFIT AFTER PRIME COSTS (GPPC)
Now we have accounted for the two largest expenses, and this is a great place to pause and see how your profit is holding up. This is often called Gross Profit After Prime Costs. Your Prime Costs are Labor and COGS, so this is your profit only considering those expenses. This is a great stopping point to evaluate your operators’ overall control of the expenses that they have the most direct control over. Many restaurants we work with set up bonus structures based on gross profit.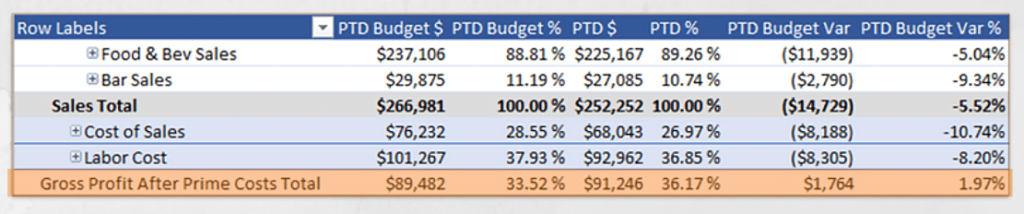
Direct Operating Costs
DOC (Direct Operating Costs) is one of the main areas that managers have the most control over on their Semi Variable and Fixed expenses. This will be where you will see all of your supply purchases, Linen, Chemicals, and misc. expenses that you need to be managing along with the rest of your prime costs daily and weekly. These line items should also be budgeted along with your COS, and we highly suggest you work off a declining spending budget to track these expenses.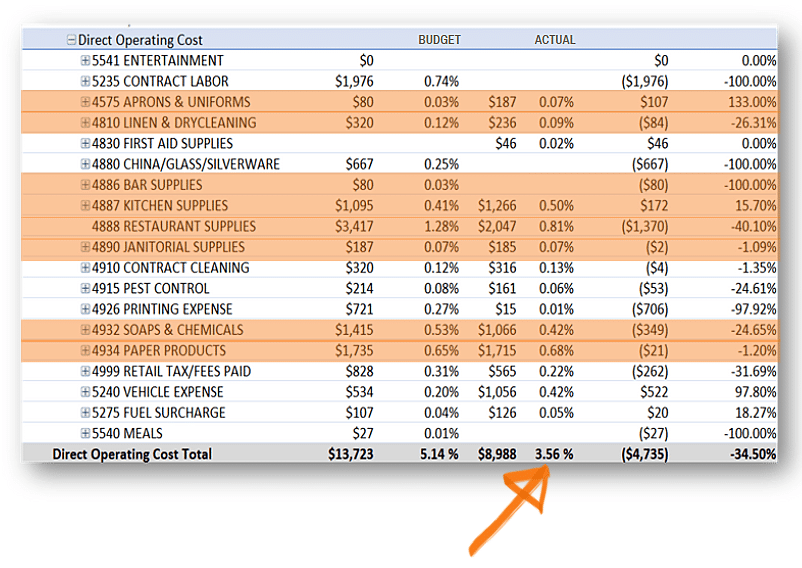
TOTAL DOC = 3.56% IF WE SPENT $0.04, THEN WE NOW HAVE HOW MUCH REMAINING OF OUR ORIGINAL $1.00? $0.32 REMAINS
WATCH THE FULL VIDEO HERE:
DOWNLOAD THE FULL P&L WEBINAR DECK HERE!
Get the full PDF Version of the Webinar
Advertising & Promotions Costs
Remember how adjusted net sales were presented earlier in the deck? You may recall that those sales at the top of your P&L should include comps and discounts. Well, this means that somewhere you have to account for those comps and discounts, and our suggestion is to account for this with the rest of your advertising costs. We are getting pretty lean on what is left in our $1.00, but before we go over the rest of those expenses, we want to touch on some considerations to be thinking about in your Advertising/Promotion category- 3rd Party Delivery Cost – Questions arise about whether the fees should be a factor in hitting Food Cost or Advertising; when you think about it, you are using these 3rd party vendors to drive revenue and how you drive revenue is through marketing – isn’t that what you are using these for? To get your brand out to off-premise diners, to help increase incremental sales? The best practice is to have the fees hit your Advertising area.
- Comps and Discounts – We want Prime costs to have 100% of your sales credit, but we do have to back out that comp expense. Since typically comps and discounts are applied to drive business, essentially internal marketing, etc., this is where those other comps will hit.
- Direct Spend on Advertising – Remember when you are setting up Advertising total % goals that your direct spend marketing in addition to your comps will be a part of that total Advertising cost %. It is important that you budget direct spend advertising $’s because this will always be an essential expense to drive top-line sales
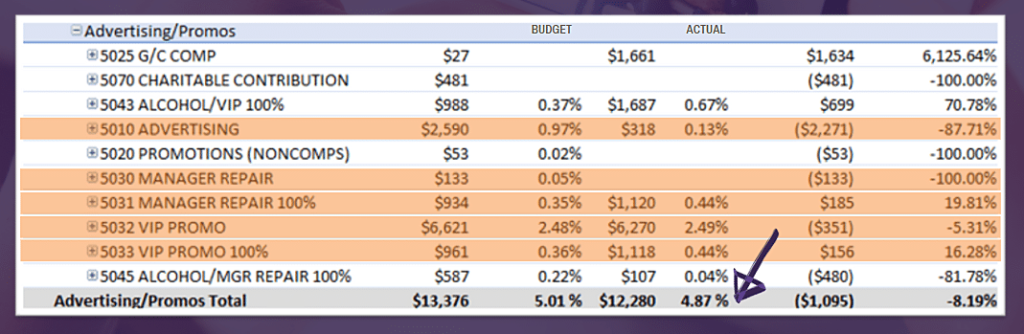
TOTAL ADVERTISING/PROMOTIONS = 4.87% HOW MUCH OF OUR $1.00 IS LEFT AFTER WE’VE SPENT $0.05 ON ADS/PROMO? $0.27 REMAINS
Which expenses are left?
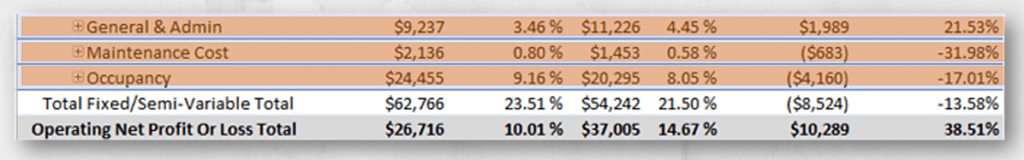
| GENERAL & ADMIN G&A = 4.45% $0.23 REMAINS | REPAIR & MAINTENANCE R&M = 0.58% $0.23 REMAINS | OCCUPANCY OCCUPANCY = 8.05% $0.15 REMAINS |
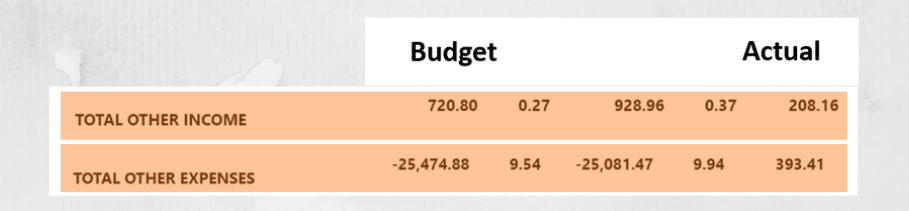
What else factors into Total Profit?
Other income and other expenses may include:- Retail
- Bonuses
- Owner Related Expenses
- Amortization & Depreciation
WHAT’S LEFT OF YOUR $1.00?

THE TOTAL AMOUNT REMAINING AFTER ALL INCOME AND EXPENSES ARE ACCOUNTED FOR IS NET PROFIT OUT OF $1.OO WE MADE IN SALES, $.05 REMAINS AS INCOME TO THE BOTTOM LINE
Best Practices for Your Restaurant P&L Review
FREQUENCY:
The more frequently you are reviewing your financial statements the better. We recommend a weekly manager meeting to review weekly P&Ls. This is especially important for the restaurant industry because things change on a dime (especially this year), commodity prices, staffing challenges, and consumer behavior. You need to be able to pivot to all of these and adjust your operational practices accordingly.MANAGER INVOLVEMENT:
The more your team is involved, the better. This does not mean a business owner spits results to the team weekly. Task managers to compile information and present it to the team; Rotate different managers. The more your team is responsible for presenting the information, the better they can understand it. Additionally, and most importantly, it helps them think “solution-oriented”.WORK OFF A PERIOD CALENDAR:
So many restaurants are doing themselves a disservice by working off a monthly calendar rather than a period-based calendar. Period-based calendars help ensure you are comparing apples to apples with period or YOY comparisons. And, again important for restaurants, each period has the same number of days.BUDGET:
During our breakdown above, you may have noticed we always showed you budgeted and actual information, and that was deliberate. Working off a budget is helpful so that everyone knows where to aim. A 30% food cost would be good for some restaurants and poor for others. Make sure everyone on your team knows where you want them to fall in terms of financial results.LISTEN TO THE FULL PODCAST EPISODE BELOW!